
Size Exclusion Chromatography belongs to the group of methods based on extraction of material for subsequent analysis. We put together a multi-detector SEC system as a more powerful tool to characterize polymers far beyond what is possible by conventional column calibration. By connecting the output of a SEC system to a single capillary viscometer, a multi-angle laser light scattering detector (MALLS) and a refractive index detector (RI) we provide absolute distributions of molar mass, radius of gyration and reduced viscosity, which are valuable both for practical polymer characterization and as tests of physical polymer theories.
Principle
Separation of polymer particles according to their size, so that the larger particles come out first, the smaller ones being delayed between the pores of the packing materials used for the separation; one has to take care in choosing an appropriate eluent. Since the chromatographic columns separate and further dilute the polymer solution, characterization of polymers is placed into the dilute regime (1 >> 2A2cMw >> 3A3c2Mw), and allows the use of Zimm equation.
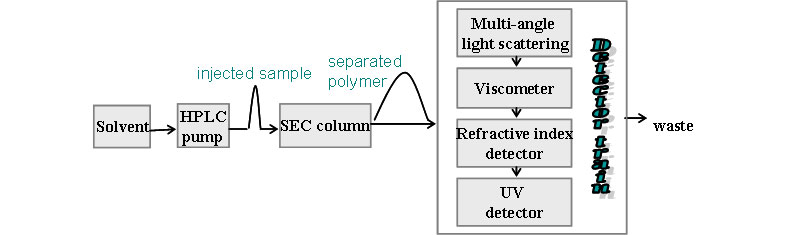
Typical SEC set-up
Why Light scattering? Traditionally, SEC columns are calibrated by measuring the elution behavior of polymer standards of known molecular mass. It is then assumed that other, unknown polymers will elute in a similar way so that their mass distribution can be determined by reference to the calibration established by the standards. The problem, of course, is that a SEC column does not separate according to mass, but rather via other mechanisms; when separation occurs according to hydrodynamic volume, the SEC mechanism is operative, meaning that, in principle, a 'universal calibration' can be applied, in which the calibration mass is multiplied by the intrinsic viscosity (hydrodynamic volume per unit mass), yielding hydrodynamic volume. There are, however, many cases where other mechanisms, such as enthalpic (e.g. electrostatic) and affinity effects control elution behavior. In this case, 'universal calibration' can break down completely. This is very often the case in aqueous systems. In order to remove mass distribution determinations from the assumptions andvagaries of column calibration, static light scattering was incorporated in the SEC detection platform. In addition to absolute molar mass at each elution slice, multi-angle static light scattering, SLS can also give the radius of gyration Rg, which allows scaling laws, branching, and conformational information about the polymer to be quantified.
Viscosity detection is a very useful complement to SLS. Single capillary and bridge capillary viscometers are widely available. The intrinsic viscosity obtained from SEC can also be related to branching and conformation, and is especially powerful when related to the values of M and Rg obtained from SLS. The viscometer can continue to measure polymers whose effective hydrodynamic radius is much smaller than the approximate 10nm lower limit for Rg of SLS, giving extra range to SEC systems equipped with both SLS and viscosity detection.
Example applications of multi-detector SEC
Analysis of a water soluble polymer, polyacrylamide (PAM)
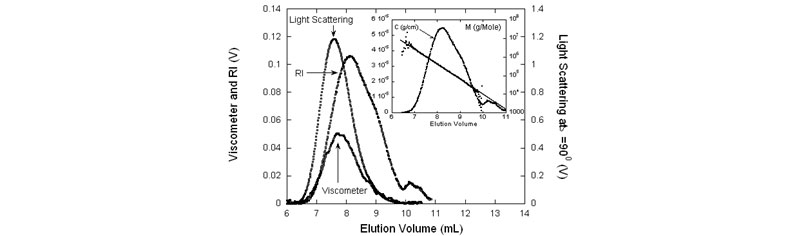
![Analysis of data, including the concentration, Rg and [η] vs. M distributions. Also shown are the various average quantities from the analysis](/sites/default/files/visc2.jpg)
Left: Raw SEC data for PAM: RI, viscometer and LS at 900 . In the inset: M both as determined directly from the LS and RI data, as well as the semi-logarithmic fit, and the concentration data, for reference. Right: Analysis of data, including the concentration, Rg and [η] vs. M distributions. Also shown are the various average quantities from the analysis.
Effect of ionic strength on the elution profile of a copolymeric polyelectrolyte
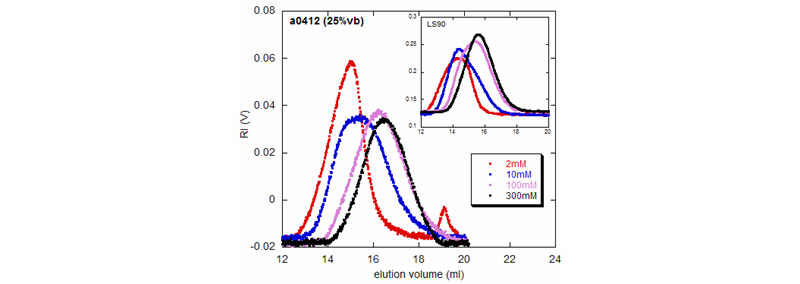
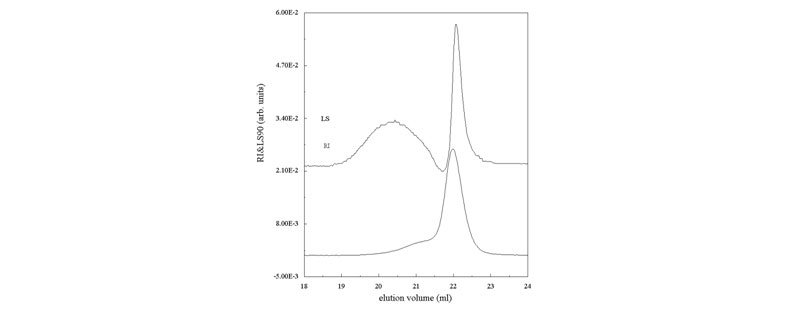
RI and LS90 (inset) voltages for a copolymeric polyelectrolyte (VB/Am) in solutions of NaCl at different concentrations
Different effects of enzymes on galactomannans samples: raw data and mass distribution
(J. L. M. S. Ganter; J. C. Sabbi; W. F. Reed, Biopolymers 2001, 59, 226–242).
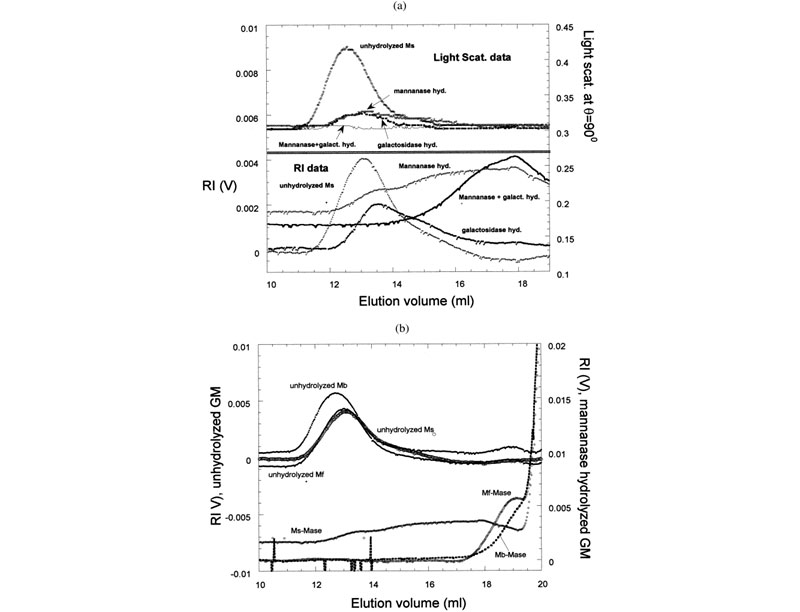

Left: (a) Raw SEC chromatograms of Mimosa scabrella (Ms), before enzymatic hydrolysis, after separate enzymatic hydrolysis by b-mannanase and a-galactosidase, and after combined hydrolysis by b-mannanase/a-galactosidase at 25°C. (b) Raw SEC chromatograms of Ms, Moldenhawera floribunda (Mf), and Melanoxylon brauna (Mb) before and after enzymatic hydrolysis by b-mannanase at 25°C. Right: Mass distribution of Mb, before and after enzymatic hydrolysis by a-galactosidase
Origin of phase separation in gelatin/oligosaccharide solutions
It is a small population, detected by light scattering, that leads to spontaneous phase separation in oligosaccharide/gelatin solutions (Vinches, C.; Parker, A.; Reed, W. F. Biopolymers 1997, 607).
Example Where Lower Mass Elutes Before Higher Mass: it illustrates how SEC columns do not necessarily separate according to M.
If deductions on a pure RI chromatogram were made using standard column calibration, they would be completely erroneous (Ghosh, S.; Reed, W. F., Biopolymers 1995, 35, 435).
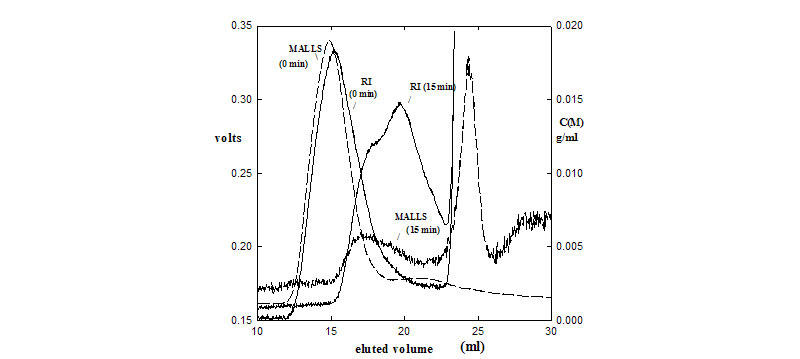
Raw RI and LS900 SEC chromatograms of proteoglycans (PG) before (0 min) and after hydrolysis by NaOH (15 min). The large LS peak at 25 mL for the backbone of the hydrolyzed PG is more massive than the glycosaminoglycans chains that elute at the 20mL peak.
