
A major focus in our research group over the years has concerned the basic physical properties of polyelectrolytes in solution; scattering, interactions, conformations, and hydrodynamics. In the past it was often thought that polyelectrolyte solutions were almost impossible to measure reproducibly by light scattering, especially at low ionic strength. While it is true that the scattering from polyelectrolyte solutions decreases dramatically as ionic strength decreases, which can lead to artifacts in solutions which are either not in equilibrium or poorly prepared, advances in modern light scattering practice and sample preparation technology have made possible high quality, quantitative scattering measurements.
Angular scattering maxima at extremely low ionic strength
At extremely low ionic strength polyelectrolyte solutions manifest some unusual features: The interparticle correlations become strong enough that there is a sort of 'liquid-like' ordering in the solution, wherein a scattering maximum occurs as a function of scattering angle, which is reminiscent of a very loose Bragg diffraction peak. An example of this is given below, which was measured for compact, water soluble, proteoglycan subunits of Mw ~1.5x10⁶ g/mole. Notice that as small amounts of salt are added the maximum is quickly lost:
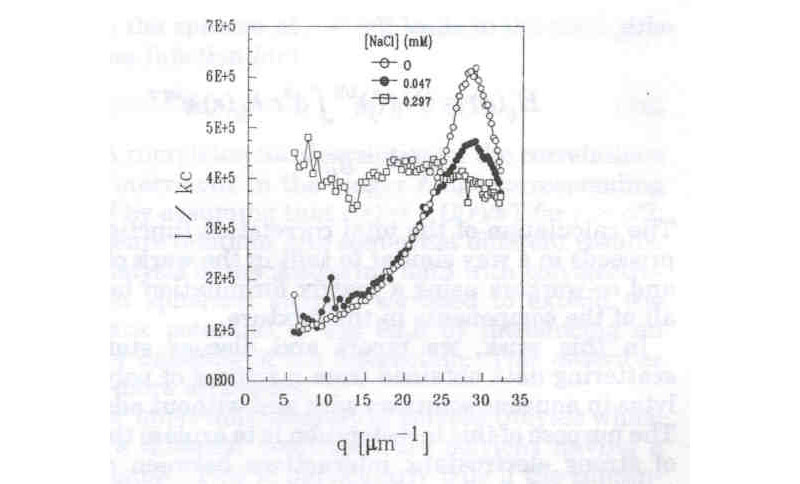
( X. Li, W. F. Reed, J. Chem. Phys. 1991, 94, 4568)
This type of peak has been successfully described by a highly damped, quasi-period interparticle potential of the form:
![]()
where R is the average interparticle separation and k the ionic strength dependent Debye screening factor. The structure factor S(q) can be computed by
S( q )=1+N d3 r [g(r)-1]e i q · r
where g(r) is the pair correlation function given by exp(-U(r)/kBT), and compared with the experimental value of S(q), obtained from the directly measured Rayleigh scattering ratios IR(q)
S(q)=IR(q)/KcMP(q)
and the measured values of P(q), obtained by extrapolation of scattering data to c=0, where c is the polymer mass concentration.
Below are the values of S(q) and g(r) computed from the above data:
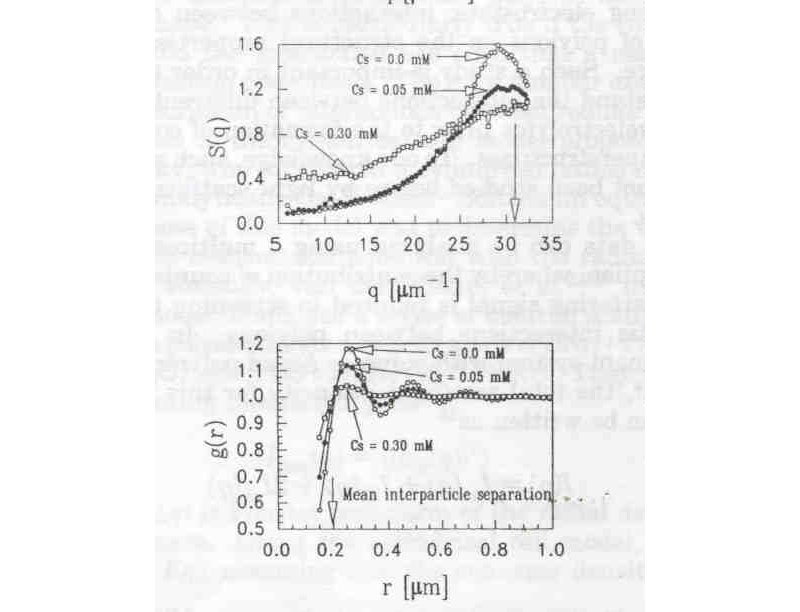
Computed S(q) and g(r) for Proteoglycan subunits (D. P. Norwood, M. Benmouna, W. F. Reed, Macromolecules 1996, 29, 4293)
The fact that these scattering maxima correspond to dynamic, liquid-like correlations involving fleeting, short-range order, is reinforced by the data below, showing that the maxima continue to be observable even under high shear conditions; namely those found in a very thin capillary under flow in an SEC system (2500 1/s shear rate). These maxima are for the same proteoglycan subunits as the above data.
(W. F. Reed, J. Chem. Phys. 1994, 100, 7825)
Modeling the effects of ionic strength and linear charge density using Electrostatic Persistence Length (EPL) and Electrostatic Excluded Volume concepts
With experimental protocols in place that give clean, reproducible data, it has been possible to test quantitatively some of the existing polyelectrolyte models. In this regard the EPL and EEV concepts as elaborated by Odijk (Polym. Sci. Phys. Ed. 1977, 15, 477; Odijk, T., Houwaart, A.C. J. Polym. Sci., Polym. Phys. ed. 1978, 16, 627) and Fixman and Skolnick (Skolnick, J., Fixman, M. Macromolecules 1977, 10, 9444. Fixman, M., Skolnick, J. Macromolecules 1978, 11, 863) have been fruitful.
A procedure we have found to be useful in computing <S2> with no adjustable parameters is to start by computing the unperturbed mean square radius of gyration from the wormlike chain expression for a random coil
![]()
where L is the contour length of the polymer, determined by Mw SLS measurement and knowledge of the mass/length in the chain, due to its chemical structure, and Lp is the persistence length.The measured <S2> for a polyelectrolyte is larger than <S2>, due to electrostatic excluded volume effects, but these effects cannot be distinguished from local stiffening effects experimentally. It is assumed that at any value of ionic strength the total persistence length is the sum of the intrinsic persistence length Lp,0 and an electrostatic contribution given by the EPL, or Le, where Le is normally a small perturbation to Lp,0. That is Lp =Lp,0 +Le, and Le was computed to be

where x is the number of elementary charges per Bjerrum length, k is the Debye-Hueckel screening parameter, and y= kL. With knowledge of Lp,0 estimated from measurements at very high ionic strength, Lp can hence be computed using Lp,0 and Le, so that <S2>0 can then be computed by the wormlike chain expression above. The measured value <S2> is related to <S2>0 via the static expansion factor as
![]()
There are several theories that relate as to the usual perturbation parameter z, given by

where Lk and Nk are the (Kuhn) statistical segment length and number, respectively, and Lk =2Lp in the coil limit. Here b is the excluded volume between two charged rodlike segments, for which Fixman and Skolnick arrived at the expression
![]()
where
![]()
where d is the rod diameter.
Of the several expressions relating z to as one that has found considerable utility when Nk >2, is the Gupta-Forsman expression
![]()
The figure below shows an example of such a calculation with no adjustable parameters, and is hence not a fit to the data. Experimental <S2> data vs ionic strength for sodium hyaluronate is also seen, and the agreement with the calculation is quite good. The data were gathered by the Automatic Continuous Mixing (ACM) technique described below and in the research link to ACM. Notice also the calculated curve (EPL only) which is what results when only EPL is taken into account in computing <S2>0 by the wormlike chain expression, and neglecting the excluded volume effect.
![(<S2>z)1/2 vs. [NaCl] obtained from data in the regime where interparticle effects are suppressed.](/sites/default/files/EEPLEVCALC.jpg)
(<S2>z)1/2 vs. [NaCl] obtained from data in the regime where interparticle effects are suppressed. The top solid line is the computation of (<S2>z)1/2 according to the combination of EPL and EEV theories outlined in the text. The lower line is the computation based only on the EPL effect (G. A. Sorci, W. F. Reed, Macromolecules 2002, 35, 13, 5218-5227).
The EEV/EPL approach can be extended to the computation of A2 with no adjustable parameters. This computation builds off the procedure summarized above, where the Yamakawa expression for A2 is used.

where
![]()
and
![]()
is Yamakawa's first order attempt at including intramolecular excluded volume into the intermolecular excluded volume problem. The figure below shows this computation for A2 on the same hyaluronate based data as in the above figure. The agreement is best at higher [NaCl].
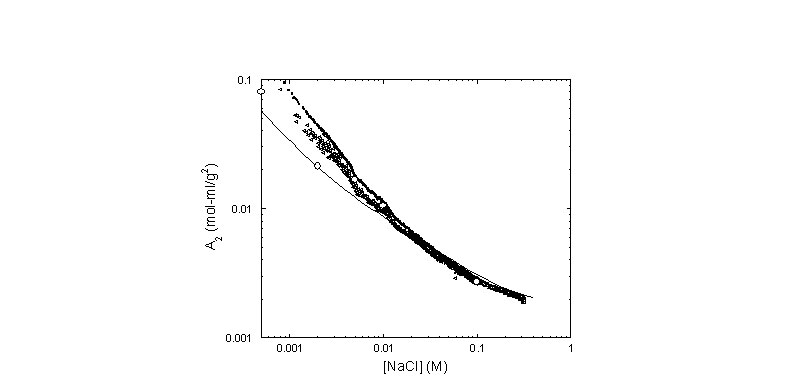
Continuous record of A2 determined from data. The hollow circles were obtained from linear fits to Kc/I(c= 0,q) at low c, at fixed values of [NaCl]. The top record (solid circles) corresponds to the first approximation to A2, and the line below it (hollow triangles) is from the convergent, iterative method used. The solid line is a computation involving combined EEV and EPL theories and involves no adjustable parameters.
Monte Carlo simulations support both the experimental data and the EPL/EEV approach
Early on in our polyelectrolyte theory we developed a Metropolis Monte Carlo simulation program for single polyelectrolyte chains, which let us explore such properties as dimensions, anisotropy, entropy, light scattering, and titration behavior.
The graph below shows the 'apparent electrostatic persistence length', Le', which, when added to the intrinsic persistence length, is proportional to the measured 2>. In this graph the discrete points for Le' come from the 2> computed by Monte Carlo simulations, and the solid lines are the EPL/EEV computations without adjustable parameters, as described above. The results EPL/EEV results are in good agreement with the Monte Carlo results, as they also are with experimental results. All show that Le' is approximately proportional to 1/sqrt(I.S.), where I.S. is the solution ionic strength.
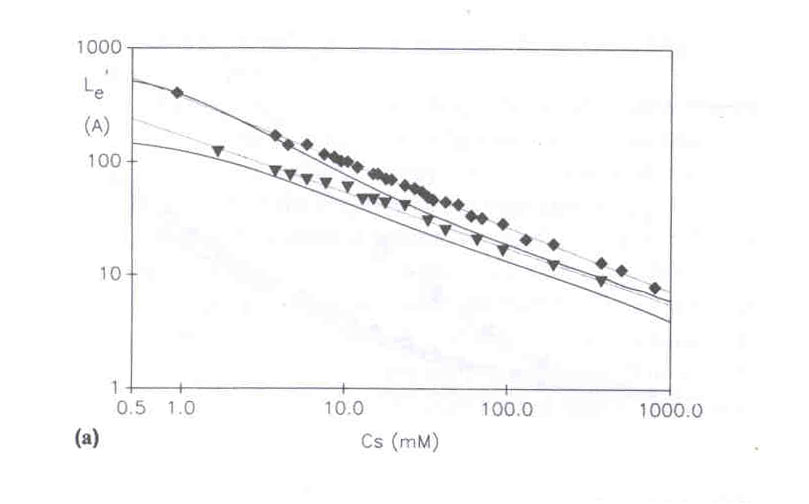
(C. E. Reed, W .F. Reed, J. Chem. Phys.1991, 94, 8479-8486)
An interesting finding continuing the Monte Carlo approach is to compute 2> vs. linear charge density at various fixed I.S., as shown below. The top data are for screening length 3.4nm, the middle for 2.4nm, and the bottom for 1.0nm. In these simulations three different charge schemes were used to produce the same average linear charge density, x; random ionization of elementary charges to give the average x, and a uniform ionization of the chain where a fictitious fractional elementary charge is used to give the average x. Surprisingly, all charge schemes give the same result, within error bars. Since several different scale lengths are involved (intrinsic and electrostatic persistence length, monomer spacing, charge spacing, screening length) it is not obvious this results should occur. The fact that it does occur, however, means that theories that treat complex, randomly distributed elementary charges can still usefully simplify calculations down to a uniform linear charge density x.
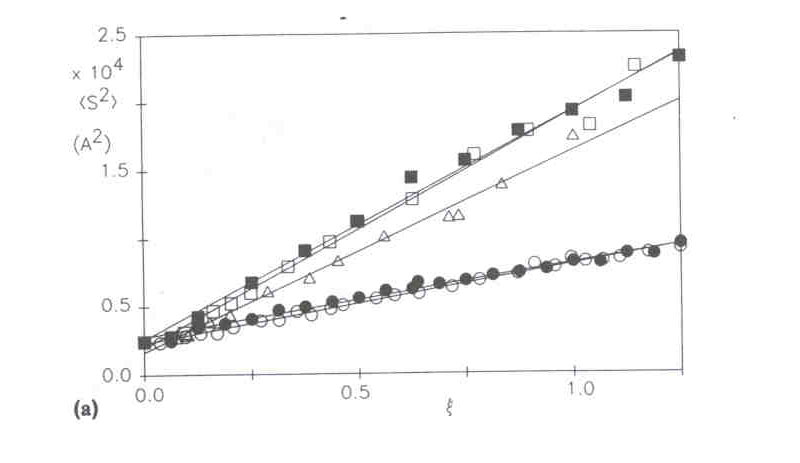
(C. E. Reed, W .F. Reed, J. Chem. Phys.1991, 94, 8479-8486)
Automatic Continuous Mixing (ACM) for high resolution studies of polyelectrolyte properties
We recently introduced ACM and have found it to be a decisive step forwards in the investigation of polyelectrolytes. For example, ACM was used in a first-ever application to determine continuously the values of A2 and A3 for a polyelectrolyte as ionic strength is varied:
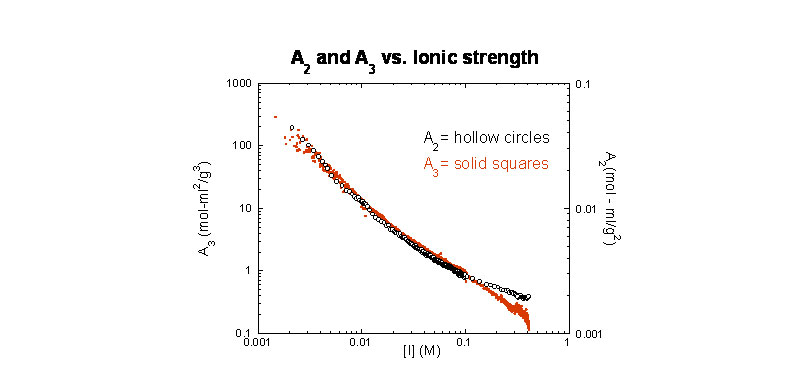
A2 and A3
A2 and A3 vs. ionic strength for sodium hyaluronate (G. A. Sorci, W. F. Reed, Macromolecules 2002 , 35(13), 5218-5227)
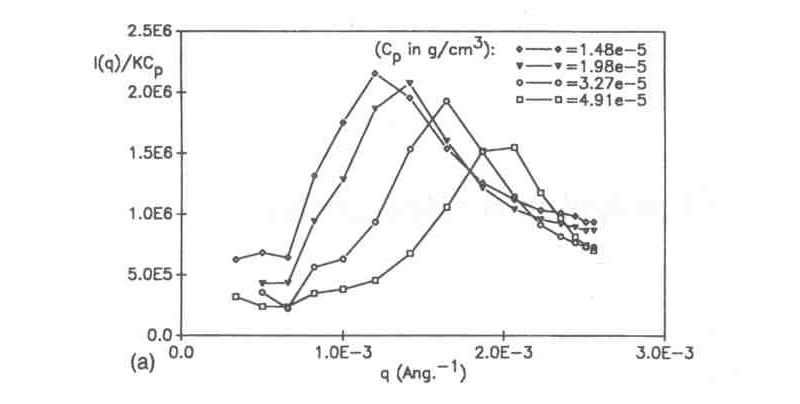
Another interesting aspect of ACM and polyelectrolytes was the recent charting of the negative slope of d(Kc/IR)/d(q2). From the scattering maxima discussion above it is clear that when there is strong interparticle correlations, such that the interparticle correlation effects in S(q) dominate over the intraparticle form factor effects in P(q) this slope will be negative. The figure below cleanly shows the negative slopes at low ionic strength as salt concentration was ramped for several different fixed sodium hyaluronate concentrations. As expected, the greater the polyelectrolyte concentration the greater the ionic strength at which the correlation effects first appear. The data were successfully rationalized in terms of an equivalent electrostatic hard sphere.
![Slope d[Kc/I(q,c)]/dq2 vs [NaCl] for fixed c.](/sites/default/files/KCISlopesHAACM.jpg)
Slope d[Kc/I(q,c)]/dq2 vs [NaCl] for fixed c. The white squares are slopes obtained by extrapolation to c=0 at fixed [NaCl]. The dashed lines are fits (G. A. Sorci, W. F. Reed, Macromolecules 2002 , 35(13), 5218-5227).
The Electroviscous Effect for linear polyelectrolytes
Using ACM the electroviscous effect for sodium hyaluronate was investigated and is shown below. The effect involves dilution of a polyelectrolyte solution at extremely low ionic strength with a solvent of the same ionic strength as the solvent in which the polyelectrolyte is originally dissolved. The hallmark of this particular electroviscous effect is the increase in reduced viscosity hr as the polyelectrolyte is diluted, reaching a maximum value, before decreasing upon further dilution.
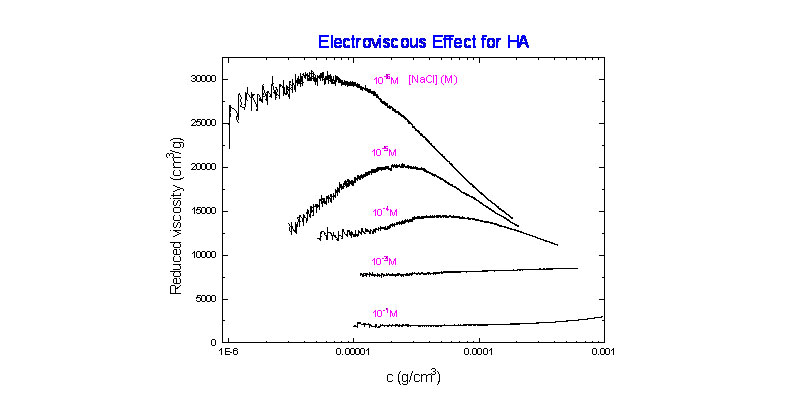
(R. Strelitzki and W. F. Reed, unpublished results)
The origin of this effect resides in the contribution to ionic strength of the polyelectrolyte's own counterions. Namely, as one dilutes the solution with the fixed ionic strength solvent, the counterions are diluted so that the net ionic strength of the solution decreases as dilution increases. The effect of decreasing ionic strength, as is well known, is to increase the polyelectrolyte coil dimensions. Most likely the due to coil expansion, the hydrodynamic volume fraction of the polyelectrolyte in solution increases even as the mass concentration decreases. The two body interaction term in the expression for hr is what leads to the net increase in hr with decreasing concentration. The origins of this, using EPL and EEV were discussed earlier, and a model calculation shown below ( M. Rinaudo, M. Milas, M. Jouon, R. Borsali, Polymer 1994, 34, 3710).

(W. F. Reed, J. Chem. Phys. 1994, 101, 2515)
Incompletely dissolved aggregates as the origin of the 'slow mode' in dynamic light scattering of very low ionic strength polyelectrolyte solutions
Over the years, there had been reports of 'slow modes' in the scattered intensity autocorrelation functions yielded by dynamic light scattering (DLS). Although 'slow modes' occur in many contexts in many different types of polymer solutions; e.g. those with aggregates, 'dust', and other impurities, a special role was claimed by some authors for the particular slow mode found in low concentration polyelectrolyte solutions at very low ionic strength. Although we never set out to study the polyelectrolyte slow mode, we also found it in some of our solutions, but also found that we could permanently remove it by proper filtration; i.e. we concluded that the slow mode in those particular cases was due to incompletely dissolved aggregates whose scattering was detectable against the very weak scattering background from the well dispersed polyelectrolytes at extremely low ionic strength. An interesting aspect of these slow modes is that, since they do not represent the fundamental state of the well dispersed polyelectrolyte chains, they actually obscure the scattering maxima from these latter. The data below illustrate this. High contrast maxima are obtained when 0.1micron cellulose nitrate (CN) filters are used, whereas when 0.2 micron filters are used there is a large decrease in the contrast of the maximum, and a higher background. This indicates that when filtered through 0.1 microns most of the SG aggregates are removed, but after passing through only a 0.2 micron filter a significant aggregate population remains. To see that pore size is not the whole story, using a 0.1 micron filter of PVDF produced scattering above both CN filtrations, indicating that PVDF does the poorest job of removing aggregates. Naturally, this aggregate removal process is irreversible; after obtaining the nice, clean scattering maximum represented by the 0.1micron data, the scattering remains stable for many days, and the background scattering from the aggregates does not occur again.
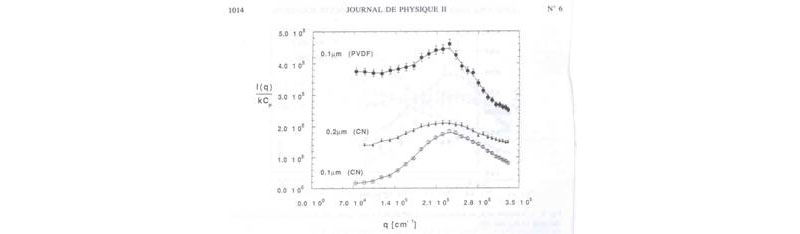
( I. Morfin, W. F. Reed, M. Rinaudo, R. Bosali, J. Physique II 1994, 4, 1001)
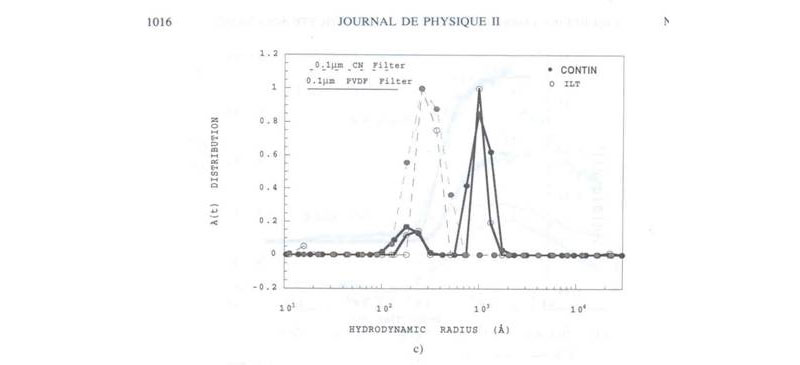
The proof that the suppression of the background scattering by proper filtration of the aggregates corresponds to the irreversible removal of the slow mode can be seen in the following figure where CONTIN and ILS transforms of DLS autocorrelation functions are seen. Where proper filtration through 0.1 micron CN is used there is no 'slow mode' (i.e. no large particle sizes in the diagram), whereas with poor filtration the DLS autocorrelation function corresponds to a bi-modal population dominated by large particles (the removable aggregates):
Further evidence of 'slow mode' aggregates captured during the monitoring of polyelectrolyte powder dissolution kinetics
Monitoring the dissolution of dry polymers is of both practical and theoretical value. The data below show the dissolution of sodium polystyrenesulfonate (NaPSS) one of the original substances for which the 'slow mode' was reported. Using a recirculating system with light scattering (LS) and refractive index (RI) detectors in-line it is possible to monitor the kinetics of dissolution. The RI reports the total mass concentration of polymer in solution at each instant. It is seen in the inset that this quantity is unaffected by the dissolution solvent, and which type of inline filter is used. In contrast, the scattering in the different cases is dramatically different, so different, in fact, that the scattering intensities are given on a logarithmic scale. No matter what the type of filter all the samples, polyelectrolytes dissolving in pure water, show a burst of intensity at the outset before settling into a baseline level of scattering, whose intensity increases as filter pore size increases; again, this simply indicates that the smaller the filter the less amount of aggregates is left in solution. The time to settle down to the baseline most likely represents the time for the least stable of the aggregates to dissolve, the baseline representing 'stubborn', very slowly dissolving aggregates, which, at any rate, disappeared after several weeks. When dissolving in salt water, however, there is no trace of the aggregates, and the light scattering trace fully resembles the RI trace; the salt water aids in the very quick dissolution of the persistent aggregates that occur at very low ionic strength. The fact that the RI dissolution does not vary much under the different conditions suggests that the mass fraction of aggregates in the solution is very low, and was estimated in this case to be less than 5%.
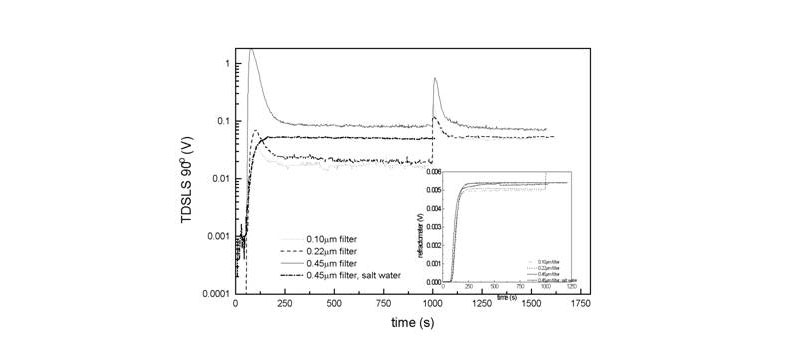
(R. C. Michel, W. F. Reed, Biopolymers 2000, 53, 19-39)
Our references on Polyelectrolytes
1. I. M. Cuccovia; E. Feitosa; H. Chaimovich; L. Sepulveda; W. F. Reed, "Size, Electrophoretic Mobility and Ion Dissociation of Vesicles Prepared with Synthetic Amphiphiles," J. Phys. Chem. 1994, 94, 3722-3725.
2. C. E. Reed; W. F. Reed, "Monte Carlo Test of Electrostatic Persistence Length for Short Polymer Chains," J. Chemical Physics 1990, 92, 6916-6926.
3. S. Ghosh; X. Li; C. E. Reed; W. F. Reed, "Persistence Length and Diffusion Behavior of High Molecular Weight Hyaluronate", Biopolymers 1991, 30, 1101-1112.
4. X. Li; W. F. Reed, "Polyelectrolyte Properties of Proteoglycans", J. Chem. Phys. 1991, 94, 4568-4580.
5. C. E. Reed; W. F. Reed, "Monte Carlo Electrostatic Persistence Lengths Compared with Experimental and Theoretical Results", J. Chem. Phys. 1991, 94, 8479-8486.
6. W. F. Reed; S. Ghosh; G. Medjahdi; J. François, "Experimental Electrostatic Persistence Length Scaling Behavior for Variably Ionized Polyelectrolytes," Macromolecules 1991, 24, 6189-6198.
7. R. M. Peitzsch; M. Burt; W. F. Reed, "Evidence of Partial Draining for Linear Polyelectrolytes; Heparin, Chondroitin Sulfate and Polystyrene Sulfonate", Macromolecules 1992, 25, 806-815.
8. C. E. Reed; W. F. Reed "Monte Carlo Study of the Titration Behavior of Linear Polyelectrolytes", J. Chem. Phys. 1992, 96, 1609-1620.
9. R. M. Peitzsch; W. F. Reed, "High Osmotic Stress Behavior of Hyaluronate and Heparin", Biopolymers 1992, 32, 219-238.
10. S. Ghosh; R. M. Peitzsch; W. F. Reed, "Polyelectrolyte Aggregates and other Particles as the Origin of the 'Extraordinary' Diffusional Phase", Biopolymers 1992, 32, 1105-1122.
11. M. B. da Silva; I. Cuccovia; H. Chaimovich; M. J. Politi; W. F. Reed, "Electrostatic Properties of Zwitterionic Micelles", J. Phys. Chem. 1992, 96, 6442-6449.
12. C. E. Reed; W. F. Reed, "Monte Carlo Study of Light Scattering by Linear Polyelectrolytes", J. Chem. Phys. 1992, 97, 7766-7776.
13. S. Ghosh; I. Kobal; D. Zanette; W. F. Reed, "Conformational Contraction and Hydrolysis of Hyaluronate in NaOH Solutions", Macromolecules 1993, 26(17), 4685-4693.
14. W. F. Reed "Light Scattering Results on Polyelectrolyte Conformations, Diffusion and Interparticle Interactions and Correlations", invited chapter for ACS Sympos. Ser. 548, "Macroion Characterization", K. Schmitz, Editor, ACS, 297-314, 1994.
15. W. F. Reed "Comments on 'Domain Structure in Polyelectrolytes; is it Real?'", Macromolecules 1994, 27, 873-874.
16. I. Morfin, W. F. Reed, M. Rinaudo and R. Borsali "Further Evidence for Liquid-like Correlations in Polyelectrolyte Solutions", J. de Physique (Paris) 1994, 4(69), 1001-1019.
17. W. F. Reed, "A Conformational Interpretation for the Peak of Reduced Viscosity for Polyelectrolytes at Low Ionic Strength", J. Chem. Phys. 1994, 101(3), 2515-2521.
18. W. F. Reed, "Liquid-like Correlations of Polyelectrolytes under High Shear Conditions", J. Chem. Phys. 1994, 100(10), 7825-7827.
19. E. Frollini; W. F. Reed; M. Milas; M. Rinaudo, "Polyelectrolytes from Polysaccharides: Selective Oxidation of Guar Gum", Carbohydrate Polymers 1995 , 27(2), 129-135.
20. M. Milas; S. Printz; W. F. Reed, "Conformations and Flexibility of Native and Renatured Xanthan", Int. J. of Biological Macromolecules 1996, 18, 211-221.
21. W. F. Reed, "Time-Dependent Processes in Polyelectrolyte Solutions", invited chapter for Berichte der Bunsen-Gesellschaft special volume on Polyelectrolytes 1996, 100(6), 1-11.
22. D. P. Norwood; M. Benmouna; W. F. Reed, "Static Light Scattering from Mixtures of Polyelectrolyes in Low Ionic Strength Solutions", Macromolecules 1996, 29, 4293-4303.
23. K. Do Amarral Risqi; M. J. Politi; W. F. Reed; T. Lamy-Freund, "Temperature and ionic strength dependent light scattering of DMPG dispersions", Chemistry and Physics of Lipids 1997, 89, 31-44.
24. D. P. Norwood; E. Minatti; W. F. Reed, “Surfactant/Polymer Assemblies: I) Surfactant Binding Properties”, Macromolecules 1998, 31, 2957-2965.
25. E. Minatti; D. P. Norwood; W. F. Reed, “Surfactant/Polymer Assemblies: II) Polyelectrolyte Properties”, Macromolecules 1998, 2966-2971.
26. R. de Cunha Michel; W.F. Reed, "New Evidence for the Non-equilibrium Nature of the "Extraordinary Diffusional Phase" in Polyelectrolyte Solutions", Biopolymers 2000, 53, 19-39.
27. E. Bayly; J. L. Brousseau; W. F. Reed, "Continuous Monitoring of the Effect of Changing Solvent Conditions on Polyelectrolyte Conformations and Interactions", Int. J. of Polymer Characterization and Analysis 2002, 7, 1-19.
28. R. C. Michel; C. T. Andrade; W. F. Reed, "Estudo da Dissolução de Polieletrólitos em Água Pura e em Meios de Força Iônica Moderada", Polímeros: Ciência e Tecnologia, 1999, 4, 142-147.
29. G. A. Sorci; W. F. Reed, "Electrostatic and Association Phenomena in Aggregates of Polymers and Micelles", Langmuir 2002, 18(2), 353-364.
30. G. A. Sorci; W. F. Reed, "Electrostatically enhanced second and third virial coefficients, viscosity and interparticle correlations for linear polyelectrolytes", Macromolecules 2002, 35(13), 5218-5227.
31. G. A. Sorci;W.F. Reed, "Effect of ion type and valence on polyelectrolyte conformations and interactions", Macromolecules 2004, 37, 554-565.
32. A. M. Alb; A.Paril; H. Çatalgil-Giz; A. T. Giz, W. F. Reed, “Evolution of composition, molar mass, and conductivity during the free radical copolymerization of polyelectrolytes”, J. Phys. Chem. B, in press.
33. A. Paril; A. M. Alb; H. C. Giz; A. T. Giz; W. F. Reed, “Online monitoring of the evolution of polyelectrolyte characteristics during post-polymerization modification processes”, Macromolecules, in press.
