
Light Scattering and Degradation
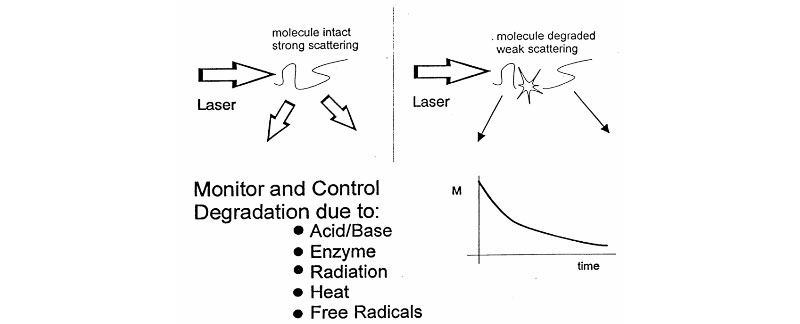
From analysis of Mass/Time curve, discover:
- does degradation occur?
- absolute scission rate
- polymer structure
- enzyme action
- degradation mechanism (random, endwise, multiple phases)
Examples of degradation process studied:
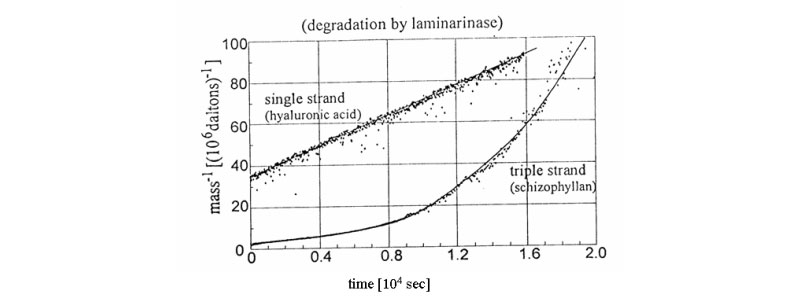
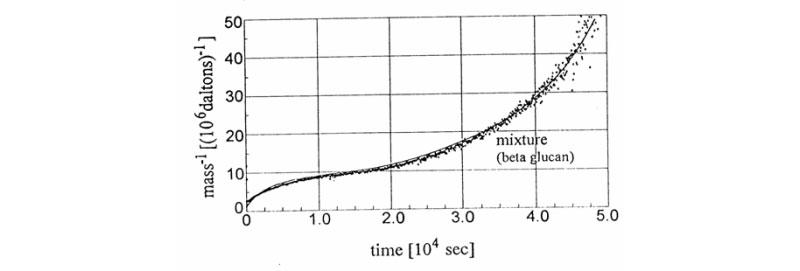
A. Signatures for time dependent light scattering enzymatic degradation of linear molecules
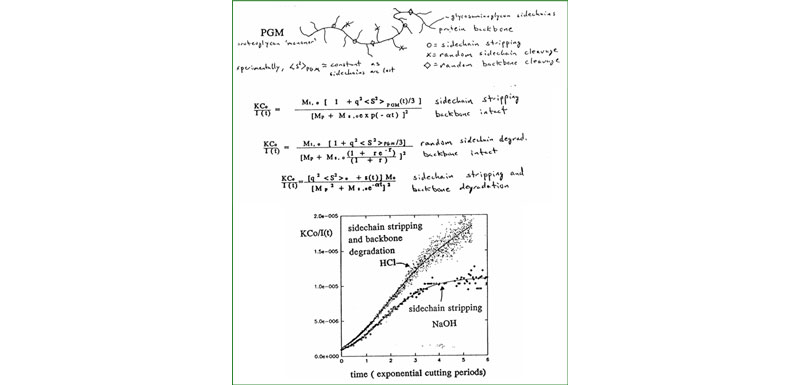
B. New signatures for time-dependent light scattering degradation of branched polymers
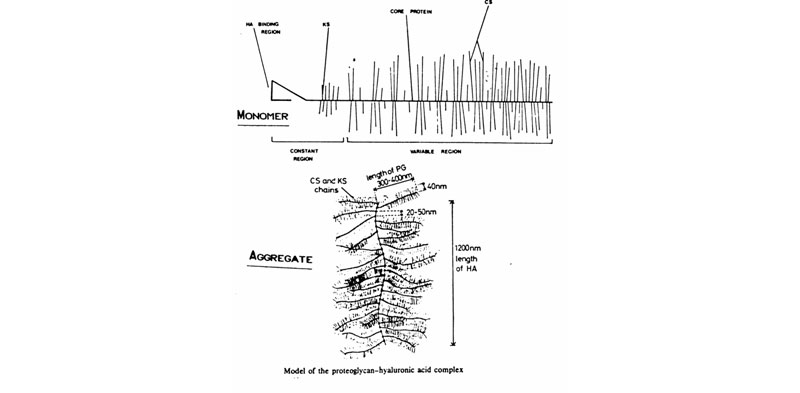
C. Proteoglycan monomers & aggregates
D. Enzymatic Degradation monitored by SMSLS - Hyaluronate degradation by hyaluronidase
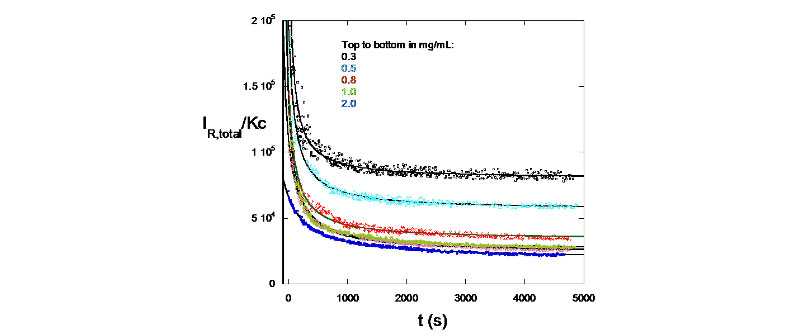
IR/Kc signatures for different concentrations of hyaluronidase used (M. Drenski, W. F. Reed, J. App. Polym. Sci. 2002 , 92, 2724)
E. Enzymatic degradation monitored by TDSLS.
Enzymatic hydrolysis was monitored in real-time using time dependent static light scattering (TDSLS) for a variety of galactomannans to determine kinetic parameters, investigate enzyme mechanisms, and make deductions concerning the sequentiality of side-chain substitution (J. L. M. S. Ganter; J. C. Sabbi; W. F. Reed,Biopolymers 2001, 59, 226–242).
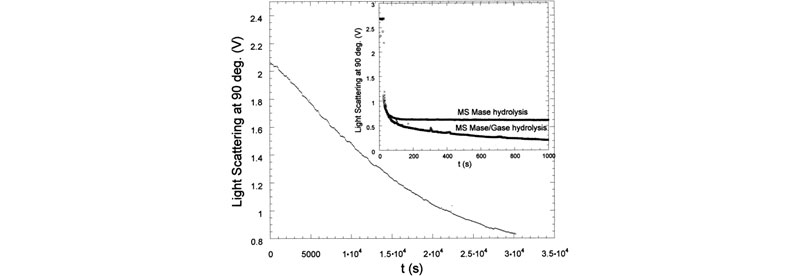
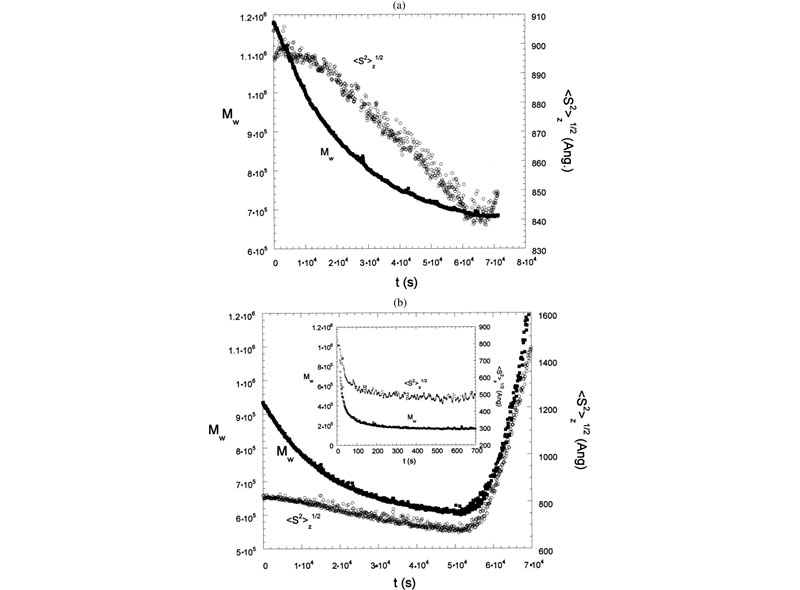
Top: LS 90° for enzymatic hydrolysis of Mimosa scabrella (Ms) by a-galactosidase. Inset shows LS 90° for enzymatic hydrolysis of Ms by b-mannanase. Also shown is hydrolysis for a b-mannanase./a-galactosidase. Bottom: Mw,ap and Rg for Moldenhawera floribunda (Mf) and Melanoxylon brauna (Mb), respectively, during the enzymatic hydrolysis with a-galactosidase. In the inset: Mw,ap and Rg of Ms during the enzymatic hydrolysis with b-mannanase.
F. Enzymatic degradation monitored by SEC
Effects of enzymes on galactomannans samples: raw data and mass distribution (J. L. M. S. Ganter; J. C. Sabbi; W. F. Reed,Biopolymers 2001, 59, 226–242).
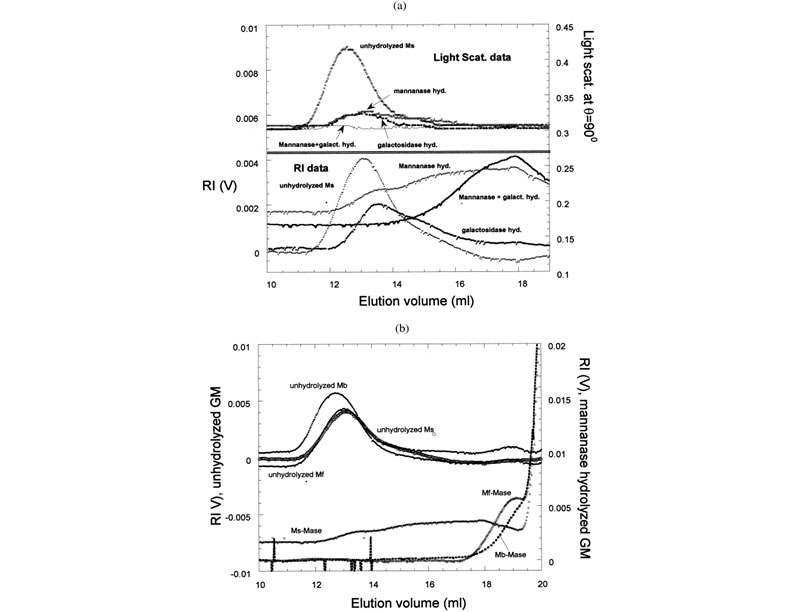

Top: (a) Raw SEC chromatograms of Mimosa scabrella (Ms), before enzymatic hydrolysis, after separate enzymatic hydrolysis by b-mannanase and a-galactosidase, and after combined hydrolysis by b-mannanase/a-galactosidase at 25°C. (b) Raw SEC chromatograms of Ms, Moldenhawera floribunda (Mf), and Melanoxylon brauna (Mb) before and after enzymatic hydrolysis by b-mannanase at 25°C. Bottom: Mass distribution of Mb, before and after enzymatic hydrolysis by a-galactosidase
